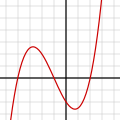
Lêer:Polynomialdeg3.svg

Size of this PNG preview of this SVG file: 400 × 400 piksels. Ander resolusies: 240 × 240 piksels | 480 × 480 piksels | 768 × 768 piksels | 1 024 × 1 024 piksels | 2 048 × 2 048 piksels.
Oorspronklike lêer (SVG-lêer, normaalweg 400 × 400 piksels, lêergrootte: 737 G)
Lêergeskiedenis
Klik op die datum/tyd om te sien hoe die lêer destyds gelyk het.
| Datum/Tyd | Duimnael | Dimensies | Gebruiker | Opmerking | |
|---|---|---|---|---|---|
| huidig | 16:33, 2 Januarie 2015 |  | 400 × 400 (737 G) | Krishnavedala | Reverted to version as of 13:02, 30 August 2008: Cleaner rendering. text and graph not clear in the newly uploaded version. |
| 08:33, 24 Julie 2013 |  | 720 × 720 (34 KG) | IkamusumeFan | 1. Redrew completely using Matplotlib; 2. Source code added; 3. Labels added. | |
| 13:02, 30 Augustus 2008 |  | 400 × 400 (737 G) | N.Mori | {{Information |Description= |Source= |Date= |Author= |Permission= |other_versions= }} | |
| 13:42, 6 Januarie 2008 |  | 400 × 400 (965 G) | N.Mori | {{Information| |Description=Polynomial of degree 3: <math>y=\frac{x^3}{4}+\frac{3x^2}{4}-\frac{3x}{2}-2=\frac{1}{4}(x+4)(x+1)(x-2)</math> |Source=Image:Polynomialdeg3.png |Date=2007-01-06 |Author=~~~ |Permission=See below |other_versions=None }} [[Cat |
Lêergebruik
Die volgende bladsy gebruik dié lêer:
Globale lêergebruik
Die volgende ander wiki's gebruik hierdie lêer:
- Gebruik in am.wikipedia.org
- Gebruik in ar.wikipedia.org
- Gebruik in az.wikipedia.org
- Gebruik in ba.wikipedia.org
- Gebruik in be.wikipedia.org
- Gebruik in bg.wikipedia.org
- Gebruik in bn.wikipedia.org
- Gebruik in bo.wikipedia.org
- Gebruik in bs.wikipedia.org
- Gebruik in ca.wikipedia.org
- Gebruik in ckb.wikipedia.org
- Gebruik in cv.wikipedia.org
- Gebruik in cy.wikipedia.org
- Gebruik in de.wikipedia.org
- Gebruik in de.wikiversity.org
- Gebruik in el.wikipedia.org
- Gebruik in en.wikipedia.org
- Gebruik in eo.wikipedia.org
- Gebruik in es.wikipedia.org
- Gebruik in eu.wikipedia.org
- Gebruik in fa.wikipedia.org
Wys meer globale gebruik van die lêer.
